Product Value Profile™
A consistent findings from our periodic research is that relatively few organizations have a formal product strategy or pricing strategy. While not a substitute for an overarching strategy, the Product Value Profile™ can provide a solid foundation for assessing a product or product line in your portfolio and thinking through changes you might make to improve value and financial performance.
Read on for an explanation of the Product Value Profile. You can also download a nicely formatted Product Value Profile handout.
Fundamentals of the Product Value Profile
Price and value are intertwined. Raise value of a product you offer, and its price can—and arguably should—go up. But to raise value, you first have to evaluate the perceived value of your products.
The Product Value Profile is a tool that offers a way to assess and visually represent the value you currently deliver with a specific product or product line and the perception of that value in the market. By doing this kind of evaluation, you get insight into what value signals you can adjust to change both the value and the price of your specific product or line of products.
Value signals are elements of your product that you actively communicate to your audience and then provide as part of delivering your offering. For learning businesses, value signals might include things such as the following:
- The reputation of the subject matter expert, or SME, involved in designing or delivering the learning experience
- Access to SMEs or facilitators
- Access to peers for support or networking
- Practice and application opportunities
- Supporting materials provided
- Availability of credit, such as continuing medical education (CME), continuing legal education (CLE), or whatever credit type is applicable to your audience
- Proof of demonstrable improvement
- Related costs (e.g., for travel)
- Venue for place-based offerings
- Software features (e.g., one-to-one messaging or gamification) for online offerings
The list above is by no means exhaustive, but it should give you an idea of typical value signals tied to continuing education, professional development, and lifelong learning.
To identify the value signals for your product and to then assess how well the product delivers on them, gather input from key sources:
- Your internal team (staff and volunteers)
- A sampling of ideal learners and customers
- What your most successful competitors are doing
Not all value signals you identify will apply to all your offerings. For example, venue doesn’t apply to online offerings, obviously. But there are other cases that may not be as obvious. An example of a value signal that might vary is length. In some situations, where learners want or need an in-depth look at a topic, a longer learning experience could be valued. In other situations, learners might prefer a targeted, tightly focused take on a topic, and the faster they can get the content, the better.
Creating the Product Value Profile
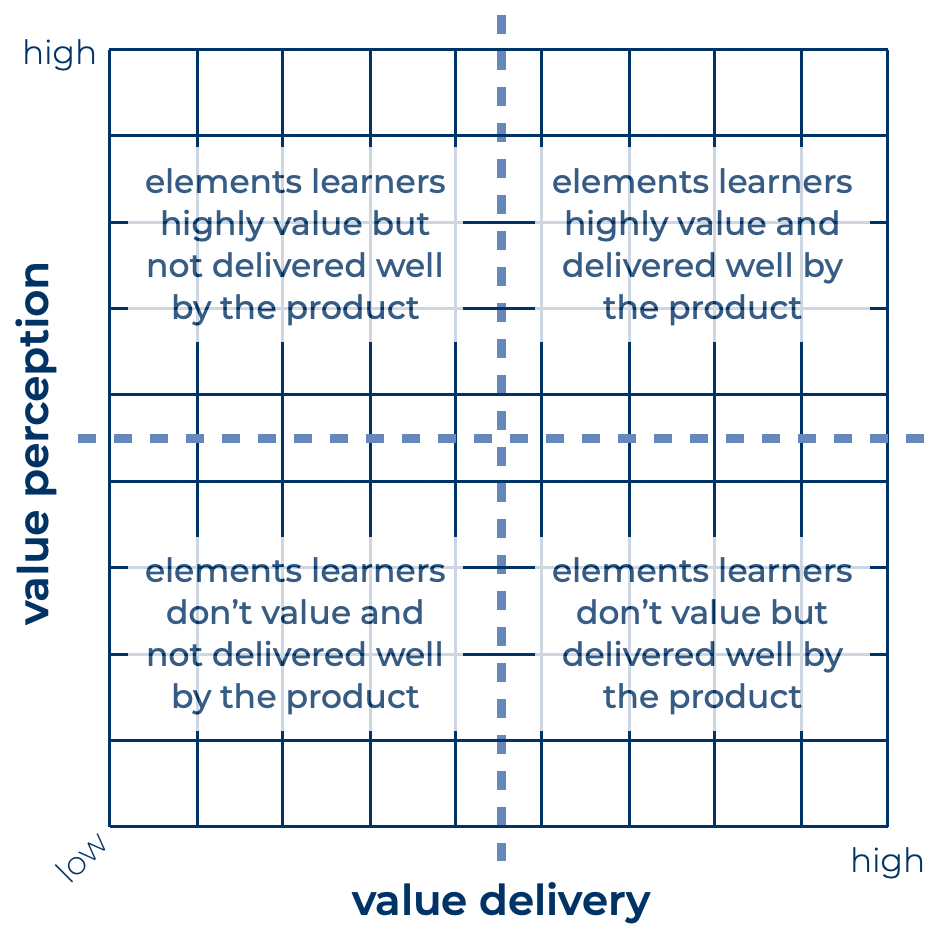
Your value signals become points to plot on the Product Value Profile, which is a double-axis chart. The vertical axis is value perception (i.e., what your learners value). The horizontal axis is value delivery (i.e., how well you deliver on that element). The two axes of the Product Value Profile create four quadrants.
The lower left quadrant is where value delivery and value perception are low, so you don’t need to give much attention here.
The upper right quadrant is elements learners perceived as valuable, and the product is delivering on that value. This quadrant is a good place to be. Very high-value products will have a majority of elements in this quadrant.
The upper left and bottom right quadrants are where you may have room to adjust. In the upper left, value perception is high—these are things your customers consider important—but this product is not delivering on them well. The bottom right is where the product is delivering well, but these aren’t elements your customers value highly—so these are aspects where you might be investing more than you should.
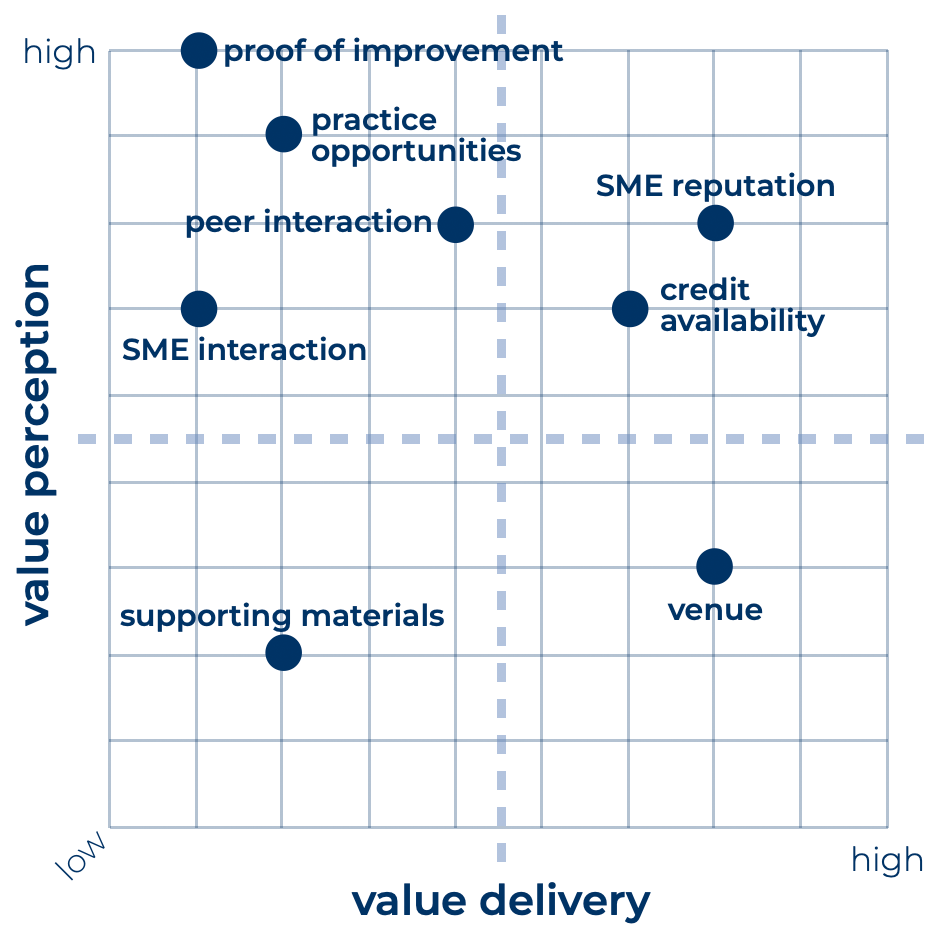
Once you know the value signals for a particular offering, plot them as points on your double-axis chart. The example below shows the profile of a fictitious product. (Your product’s value signals and ratings will vary.)
Insight from the Product Value Profile
Given the effort involved, you may not create a Product Value Profile for every product you offer, particularly if your portfolio is large. Instead, you might focus on a product line or on a product that isn’t performing as well as expected. Conversely, if you have a product that is beating projections and outperforming other similar offerings in your portfolio, you can use the Product Value Profile to better understand the value of the product. Once you do, you may be able to apply what you learn to improve other products.
If you are not achieving the sales expected with a particular offering, you can take steps to adjust the value signals so that value will be perceived as more in line with the price. To do that, take steps to improve your delivery of some or all of the signals in the upper left quadrant to move them into the upper right. You might also consider at the same time eliminating or reducing things in the lower right to help offset costs that the improvements require.
A second approach, particularly if a product is selling well, but you want to reposition it on your Value Ramp, is to improve delivery of elements in the upper left quadrant and then raise prices. In general, the Product Value Profile is a good tool for evaluating your offerings and making decisions that enable you to change them relative to price.
The goal is not to shift everything into the upper right quadrant where value delivery and value perception are both high. It might seem like that is the goal, but it is usually impractical and often cost-prohibitive to shift everything to the upper right quadrant.
The goal is to identify high-value items that you do (or can) deliver on better than the competition and focus on getting those as high as possible in the upper right quadrant. Ultimately, you want a value profile that is as attractive as possible while clearly standing out from the profiles of your key competitors.
The Value Ramp and the Product Value Profile
The Product Value Profile and the Value Ramp complement each other. The Value Ramp helps you visualize your entire portfolio and tell an overarching value story.
The Product Value Profile helps you zoom in to better understand particular offerings that fall along your Value Ramp.
The Value Ramp and the Product Value Profile are descriptive tools and tools for change. They both help you assess and understand your current offerings, but they both also offer insights that might lead to changes and improvements.
Once you understand your Value Ramp and the Product Value Profiles of your products as they currently exist, you have a solid basis for making adjustments and using value signals to influence how your products are perceived and therefore what you can charge for them and where they might come to fit on a future Value Ramp you aspire to make reality.